I thought I would update the weekly Gann/Fib chart I did a few weeks back in order to show how things are progressing in terms of that market geometry. I also added a little fib range between the lower end of the geometric range and the bottom of the fib lines (click to enlarge):
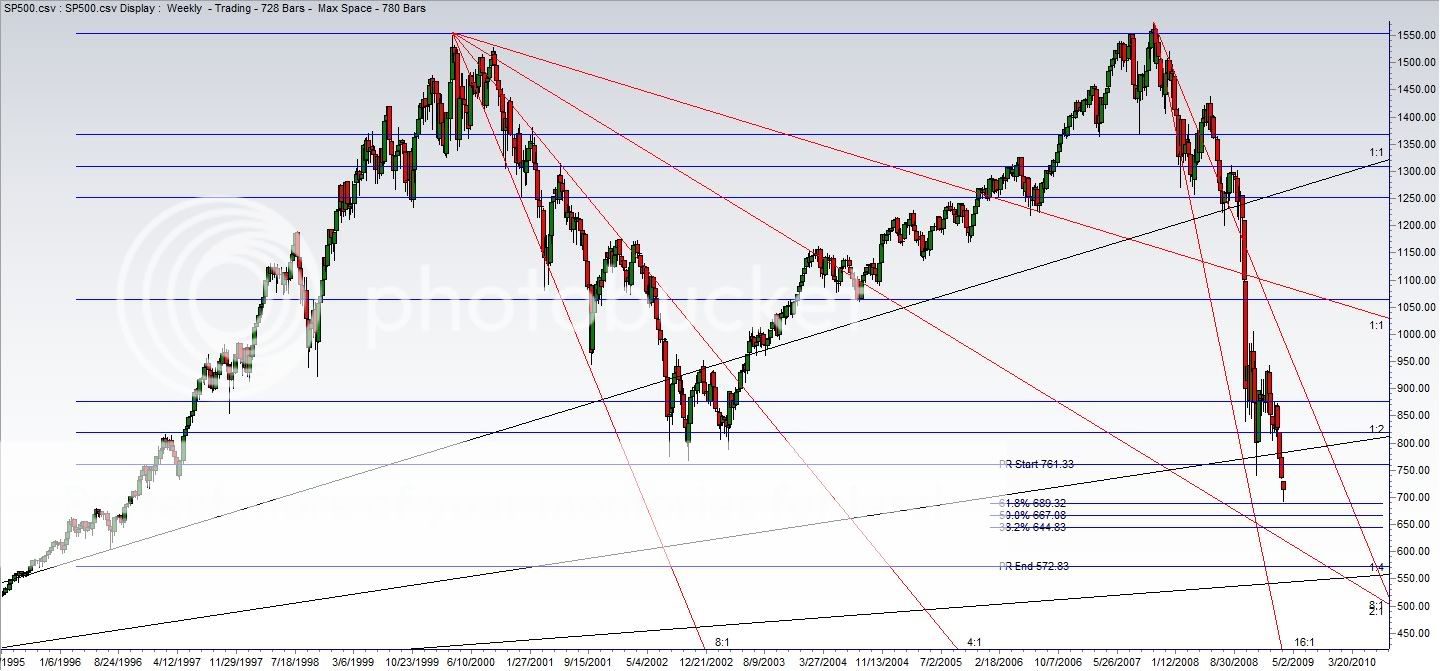
Interesting so far how this market geometry is respected.
As I mentioned below in a post this morning, it is also interesting to lay the bottom of this fib range along the 61.8% line of the Dow dating back to the 1930's (from Brian Shannon's blog at http://alphatrends.blogspot.com - you can see the image I am referring to here).
No comments:
Post a Comment